
Die EXPO REAL 2026 steht vor der Tür. Auf nach München, heißt es daher für die Bau- und Immobilienbranche. Für mich auch immer ein Weg zu Teilen meiner Familie und zu Top-Mandanten – in eine Top-Stadt.
Das belegt aktuell der Report „Mapping the World’s Prices – 2026“ vom Deutsche Bank Research Institute.
Im Quality-of-Life Index ist München der große Gewinner, mit einem gewaltigen Sprung von +8 auf Platz 4, gefolgt von Frankfurt a.M. (+1). Berlin schafft es auf Platz 28. Gute Nachricht auch für glückliche Europäer: Die Top 10 sind rein europäisch besetzt.
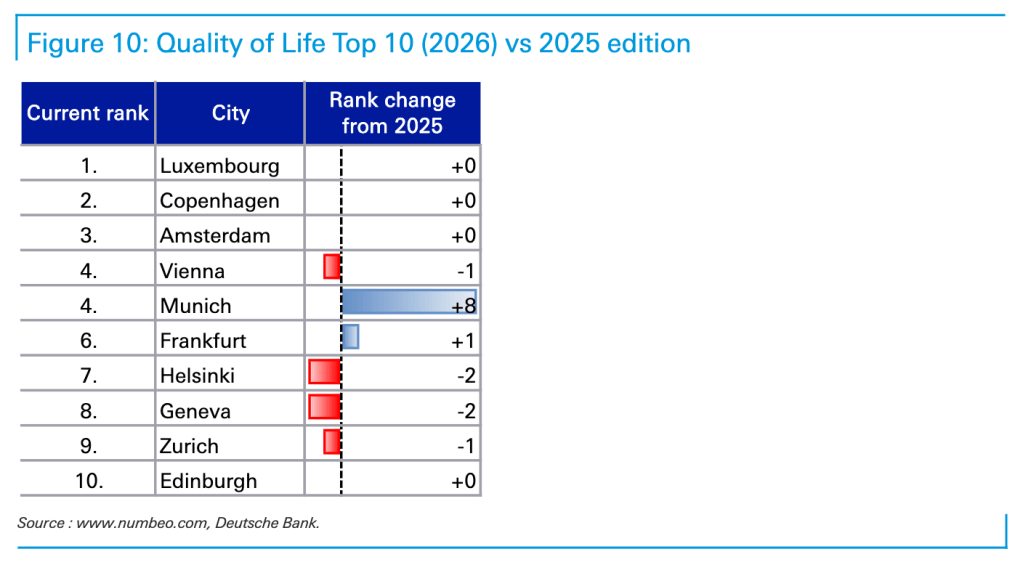
Global financial hubs like Paris (43rd), New York (46th), London (47th), and Hong Kong (55th), score lower on liveability, hampered by expensive housing, long commutes, and high pollution levels. However, this is a highly subjective measure.
Mapping the World’s Prices – 2026″ – Deutsche Bank Research Institute, Jim Reid, Global Head of Macro and Thematic Research / Galina Pozdnyakova, Research Analyst, July 13, 2026

In der Kategorie Miete „Monthly rent for 3 bedroom apartment in city centre“ liegt München zwar „nur“ auf Platz 26, was aber Platz 1 der deutschen Städte bedeutet (Bild). Das sind „nur“ 35% des Wertes des Spitzenreiters New York. Aus deutscher Sicht folgt Frankfurt a.M. auf Platz 30 und Berlin auf Platz 34.
| Rang | Stadt | Veränderung Rang (vs 2025) | Veränderung in % (10-yr) |
|---|---|---|---|
| 1. | New York | 0 | +49,4 |
| 2. | Zurich | +4 | +74,5 |
| 3. | San Francisco | +1 | -9,3 |
| 4. | Boston | -2 | +45,8 |
| 5. | Singapore | -2 | +35,6 |
| 6. | Los Angeles | +3 | +43,8 |
| 7. | Hong Kong | -2 | +1,3 |
| 8. | London | -1 | +5,6 |
| 9. | Sydney | +2 | +34,8 |
| 10. | Geneva | -2 | +22,0 |
| … | |||
| 26. | Munich | -4 | +41,1 |
| … | |||
| 30. | Frankfurt | +1 | +46,8 |
| … | |||
| 34. | Berlin | -4 | +76,9 |
| … | |||
| Titel: Monthly rent for 3 bedroom apartment in city centre | FNI | Auszug: Dr. Elmar Bickert | Quelle: Mapping the World’s Prices – 2026″ – Deutsche Bank Research Institute |
Berlin weist „nur“ 30% des Wertes des Spitzenreiters New York auf, was den Ruf einer verhältnismäßig günstigen Weltstadt bestätigt und manch eine Enteignungs- und Regulierungsphantasie hysterisch erscheinen lässt. Sicher, die Einkommensseite ist eine andere, dies aber rechtfertigt keine pauschale Bremse oder Deckelung von Mieten oder gar „Vergesellschaftung“.
Und der Deutsche Bank Research Institute-Report weiß auch hierzu Antworten in der Kategorie „Verfügbares Einkommen nach Abzug der Miete (2 Personen, die arbeiten und eine 3-Zimmer-Wohnung mieten)“:
- Frankfurt a.M.: Platz 10 (-3 vs 2025), +49,1% (10-yr),
- München: Platz 12 (-2 vs 2025), +33,9% (10-yr)
- Berlin: Platz 18 (+4 vs 2025), +28,1% (10-yr)
Gegenüber New York sind das +249% (Frankfurt), +238% (München) und +185% (Berlin).
Bei den Kaufpreisen (Price per square meter to buy apartment in city centre) liegt
- München auf Platz 13 (+2 vs 2025), +44,5% (10-yr)
- Berlin auf Platz 30 (+2 vs 2025), +81,5% (10-yr) und
- Frankfurt a.M. auf Platz 34 (-1 vs 2025), +39,2 (10-yr).
Cities that make the top 10 for both quality of life and disposable income are Luxembourg, Copenhagen, Frankfurt, Geneva and Zurich – all European. No US city makes both lists.
Mapping the World’s Prices – 2026″ – Deutsche Bank Research Institute, Jim Reid, Global Head of Macro and Thematic Research / Galina Pozdnyakova, Research Analyst, July 13, 2026
Berlin hat es im internationalen Vergleich sogar zur Nr. 1 geschafft. In der Kategorie „Monatliche Grundversorgungskosten (Strom, Heizung, Kühlung, Wasser, Müllabfuhr) für eine 85 m² große Wohnung“ ist
- Berlin auf Platz 1 (+1 vs 2025), +47,1% (10-yr)
- München auf Platz 6 (-5 vs 2025), +33,0% (10-yr) und
- Frankfurt a.M. auf Platz 7 (+2 vs 2025), +47,9% (10-yr).
Das ist natürlich nicht positiv. Aber das weitet bei der Frage nach den Wohnkosten den Blick etwas von der reinen Nettokaltmietenbetrachtung zu den Nebenkosten.

„Housing remains the thread that runs through almost every liveability discussion. High salaries alone do not guarantee a comfortable life if rent consumes the gains. This is why cities such as Luxembourg, Copenhagen, Zurich, Geneva and Frankfurt stand out: they combine high quality-of-life scores with strong disposable income after housing costs. By contrast, New York, London, Paris and Hong Kong remain global magnets for talent and capital, but their liveability scores are weighed down by expensive housing, long commutes, pollution or affordability pressures. The lesson is that the richest cities are not always the easiest places to live.“
Mapping the World’s Prices – 2026″ – Deutsche Bank Research Institute, Jim Reid, Global Head of Macro and Thematic Research / Galina Pozdnyakova, Research Analyst, July 13, 2026
Mag ein solcher internationaler Blick helfen bei der realistischen Bewertung von aktuellen Enteignungs- und Regulierungsplänen.
Auch der EXPO REAL tut dieser Blick gut, bestärkt er doch jene, die gerne in diesen Städten, in diesem Land und auf diesem Kontinent leben, arbeiten, (ver-) mieten, betreiben, investieren, projektieren und bauen.
© Copyright by Dr. Elmar Bickert
Beitragsbild: Jetpack AI


Du muss angemeldet sein, um einen Kommentar zu veröffentlichen.